Introduction
What is TissueMAPS?
TissueMAPS is a computational framework for interactive visualization and distributed analysis of large-scale microscopy image datasets.
High-throughput image-based screens amount to terabytes of image data. The size of the generated datasets make it impractical to store and process data on a local computer, but rather calls for remote scale-out solutions.
Available applications for microscopy image analysis are generally designed to run on a single desktop computer with a graphical user interface (GUI). TissueMAPS instead uses a distributed client-server model optimized for processing image data in parallel in modern virtual cloud environments. It combines an intuitive, user-friendly browser-based frontend with a scalable backend to process multi-terabyte image datasets in an interactive and responsive manner.
Client-server architecture
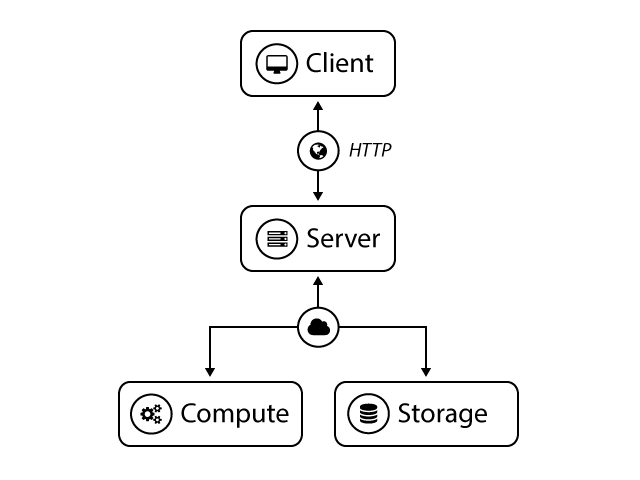
Computational infrastructure.
The TissueMAPS server exposes a RESTful API that abstracts away the complexity and implementation details of the underlying compute and storage infrastructure. Clients send HTTP request messages to the server, who handles the requests and returns response messages to the client. The server processes these requests asynchronenous and submits computational tasks to available compute resources. Clients can interact with the application through the web user interface via a standard web browser or use other HTTP client interfaces, which are available in various programming langunages (Python, Matlab, R, …).
TissueMAPS represents a compromise between abstraction and performance, emphasizing usability and rapid development, while enabling efficient processing of big datasets. It uses a modular object-oriented design to facilitate extension and customization. The server-client model further enforces a strict separation of user interface and actual processing through REST services, which results in more resource-optimized code for headless execution in a distributed environment.
As a consequence of its distributed nature, the different components (web server, application server, database servers, file system servers, compute units, …) may not necessarily all run on the same machine. To facilitate setup and deployment, code is partitioned into different packages and hosted by separate repositories. The main TissueMAPS repository combines the individual repositories at the latest stable release version.
Client code
Clients interact with the server through an HTTP interface:
The TmUI repository holds the Javascript code for the browser-based user interface, implemented as an AngularJS app. Although technically client code, the app gets installed server side, since code is served to clients upon request via the browser.
The TmClient repository holds the tmclient package implemented in Python, Matlab and R for more programmatic interaction with the server, e.g. upload and download of data. These packages are light-weight RESTful API wrappers with only very few dependencies. They get installed directly on client machines. The Python package further exposes a command line interface (tm_client).
Server code
The server backend is implemented in Python - a well-established general purpose language, which is widely used in the scientific community. It provides powerful packages for scientific computing (NumPy, Pandas), image processing (Mahotas, OpenCV) and machine learning (Scikit-Learn, Theano).
The TmServer repository holds the server application that handles client API requests. The tmserver package delegates the actual processing to the tmlib package, which is provided via the TmLibrary repository.
Browser-based user interface
Viewer
At the heart of the TissueMAPS lies the interactive viewer for multi-scale representation of 5D microsopy image data. It enables users to browse multi-channel raster images across different resolution levels and time points and overlay segmented objects as vector graphics. Image datasets are generally too big to be served to the client en bloc. Therefore, datasets are tiled up and dynamically streamed from the server for display. The client application only requests the subset of raster and vector tiles relevant for the current view and renders and caches them efficiently on the local graphics card via WebGL. This results in a smooth user experience with reduced bandwidth. Key features are support for brightfield and fluorescence mode, toggling and colorization of different channels and objects as well as instant intensity scaling and opacity adaptation for individual channels and object types, respectively.
Data analysis tools
In addition to visualization, the viewer provides plugins for visually-assisted data analysis and machine learning. These tools allow users to interact with objects on the map, query information about them and subject them to to further analysis. Users can, for example, colorcode objects according to precomputed feature values and on the fly computed classification labels or visualize objects in multivariate feature space alongside their spatial map represenation.
Workflow Manager
The zoomable multi-scale representation requires overview images in form of tiled pyramids. In addition, objects of interest (e.g. individual cells) need to be computationally identified in the images and quantitatively assessed by means of image segmentation and feature extraction, respectively, before they can be displayed on the map and used for further analyis.
Serveral interdependent processing steps are usually required to get from the raw images as outputted by the microscope to the final single-cell feature matrix. TissueMAPS provides a user-friendly interface to setup automated image analysis workflows, submit them to a cluster for distributed processing, monitor the status of submitted computational jobs and report results and statistics for these jobs upon their completion.
For more information, please refer to the user interface section of the user guide.
RESTful active programming interface
Under the hood, the user interface issues HTTP requests to access server side resources via a Uniform Resource Identifier (*URI*), or more specifically a Uniform Resource Locator (*URL*). Some resources are specific to the user interface, such as HTML templates that should be rendered in the browser. Other more general resources, such as image or feature data, are accessible through the REST API. These resources begin with /api and can be accessed via any HTTP client interface. This allows a programmatic, browser-independent interaction with the server, for example to upload and download data or submit workflows for processing and monitor their status.
The tmclient Python package serves as an example of how such an interface can be implemented. For more information, please refer to the RESTful programming section of the user guide.
Distributed image processing
An image processing workflow represents a series of steps, each of which comprises a set of computational jobs that get distributed across available compute resources for parallel processing. Functionally related steps are further grouped into abstract stages. The entire workflow can be submitted for processing or individual stages can be submitted one after the other. Since results of each step are persisted on disk, workflows can further be resubmitted from any given stage.
The tmlib.workflow package provides functionality for generating and managing distributed image processing workflows. Each of the steps is implemented as a subpackage of tmlib.workflow and represents a parallel computational task collection that can also be invoked separately via the command line.
The following “canonical” TissueMAPS workflow for automated analysis of multi-wellplate screens is used here for illustration. To meet specific user requirements, custom workflows can be easily created, either by modifying or extending existing workflows or by creating new ones from scratch.
Canonical workflow

Stages of the canonical workflow.
Image conversion
Image pixel data and metadata are extracted from heterogeneous microscopy file formats and stored in a consistent way, which is optimized for efficient downstream parallel processing.
Steps:
- metaextract: Extraction of metadata
- metaconfig: Configuration of metadata
- imextract: Extraction of image data
Image preprocessing
Global statistics are computed across all images and persisted for use by subsequent processing steps.
Steps:
- corilla: Calculation of illumination statistics
Pyramid creation
Image pyramids are created for interactive visualization. The user can optionally apply illumination statistics generated in the previous stage to correct images for illumination artifacts.
Steps:
- illuminati: Image pyramid creation
Image analysis
Images are subjected to image segmentation and feature extraction. Jterator provides an interace to build and run custom image analysis pipelines, which can be constructed from available modules. These modules are available through the jtmodules package hosted by the JtModules repository.
Steps:
- jterator: Image segmentation and feature extraction
Interactive analysis tools
The tmlib.tools package provides an extendible plug-in framework for data exploration and analysis.
These tools enable users to perfom explanatory data analysis directly on the map in an interactive and responsive manner and thereby combine quantitative, statistical analysis with human visual pattern recognitition. Each tool has a client and a server side representation. The client provides an interface for the user and sends tool requests issued by the user to the server. The server handles requests (a computation and/or database query) and responds with a tool-specific result that the client knows how to interpret and visualize. Tool request are handled asynchronously and submitted to the cluster for processing.
What can these tools be used for? Let’s consider the following example: After extracting a multitude of features for segmented objects , you may be interested in the distribution of feature values and identification of outliers (interesting phenotypes or artifacts). In addition, you may want to visually compare the results of your analysis with the images from which the features were extracted. To this end, you may download the dataset, load it into R and generate some fancy gg-plots. Once you have found an interesting pattern in data, you would have to go through painful rounds of indexing to find the pixels corresponding to your data points of interest (segmented objects) back in the original images. TissueMAPS tools provide a framework to perform such explorative analysis via the user interface in an automated way that facilitates hypothesis testing.
